Which Dental Demographics Belong in a Territory Decision?
A practical framework for using area-level demographics as qualified territory context—not as a demand, revenue, or sales forecast.

Short answer
Which demographics should inform a dental territory decision?
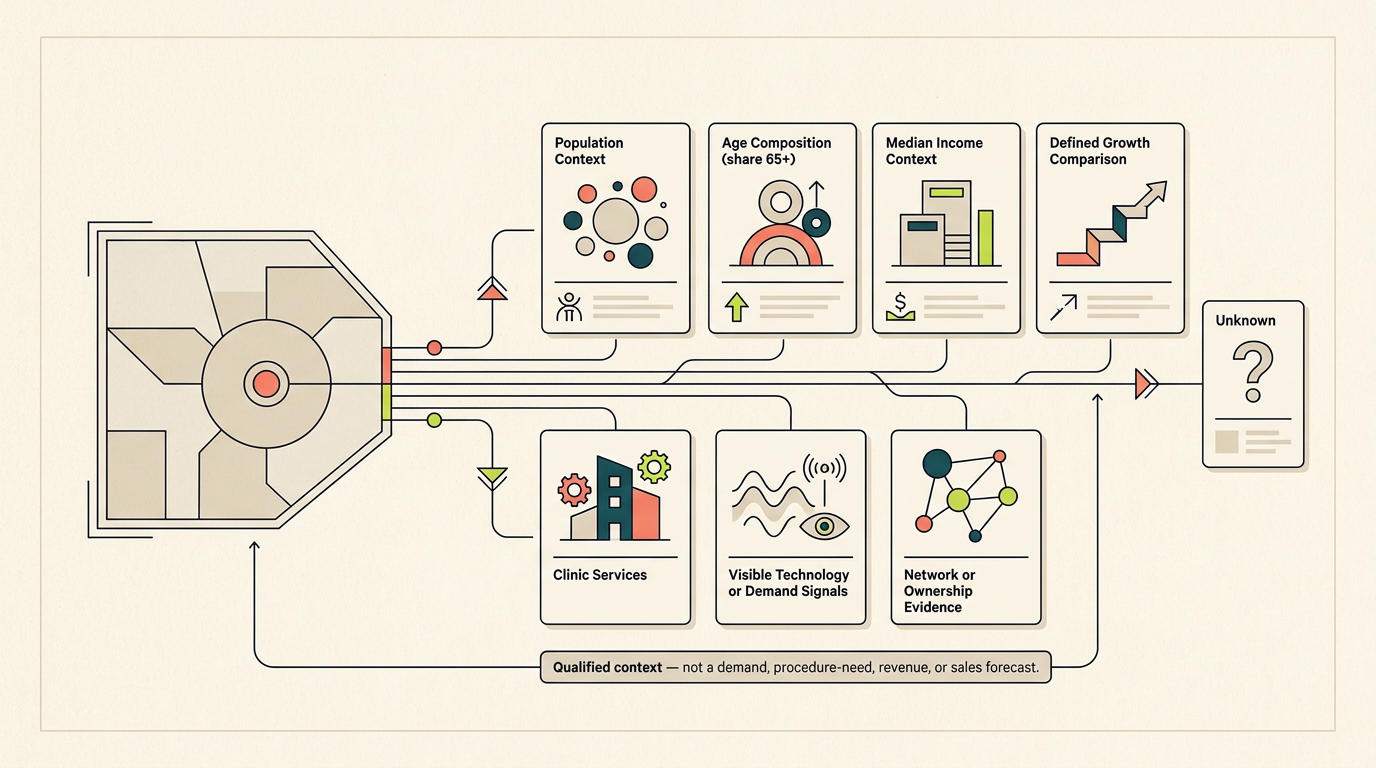
Use area-level population, age composition such as share aged 65+, median income, and a precisely defined growth measure as qualified context for a bounded territory. Retain ACS geography, estimate period, geography vintage, definition, and margin of error, then pair demographics with separately sourced clinic, service, and network evidence. Do not treat these measures as a demand, procedure-need, revenue, or sales forecast.
If you plan sales territories, research investments or help a dental group expand, demographic data can help you understand an area. It cannot tell you how many people will need a procedure, become patients or buy from you.
Start with population, age, income and change over time. Then check what each figure measures and how it was collected.
Start with the decision boundary
Define the area you want to study. A metropolitan area, a county and a smaller neighborhood can tell different stories. Choose the boundary that fits your question and record its exact name and identifier.
The US Census Bureau’s American Community Survey (ACS) provides estimates for several types of area. These include counties and smaller Census areas called tracts and block groups. A ZIP Code Tabulation Area, or ZCTA, is another geographic unit; do not treat these units as interchangeable.
This article does not assess a named territory or rank markets. No specific area, business threshold or set of clinics was supplied.
Use four variables for context
Population: how many people live in the area? Record the source, area and time period. For population totals, the Census Bureau recommends the ten-year Census or its Population Estimates Program rather than ACS. See its comparison guidance.
Age: what share of residents are 65 or older? This describes the area’s age mix. It does not establish what treatments people need or reveal the characteristics of an individual patient. Keep the source table, definition, time period and total population used to calculate the percentage.
Median income: what is the middle value in the chosen income measure? Keep the source’s exact definition. An area’s income figure does not tell you what someone will spend on dentistry or whether they want to buy.
Growth: what changed between comparable periods? Use the same measure and comparable boundaries. Check whether the apparent difference is larger than the uncertainty in the estimates before describing it as meaningful change.
DentalCensus’s territory capability describes demographic figures as context for deciding where to investigate further. They are not a promise of demand or sales.
Choose the ACS product deliberately
ACS estimates come in different versions. The Census Bureau’s guidance explains the tradeoff:
- One-year estimates are more current and cover areas with at least 65,000 people.
- Five-year estimates combine a larger sample, cover all areas and are more precise, but are less current.
Label a five-year estimate with its full period. Do not compare it directly with a one-year estimate.
Also record which year’s boundaries the figure uses. This is sometimes called the geography vintage. For an ACS five-year estimate, it is the final year of the period. A boundary change can affect the comparison. See Census boundary guidance.
Treat uncertainty as part of the evidence
ACS uses a sample, so its figures are estimates. Each comes with a margin of error (MOE), which helps show how uncertain the estimate is. Keep that value beside any figure used to compare territories.
A higher displayed number is not enough to establish a meaningful difference. Compare estimates with the same period length. For five-year changes, use periods that do not overlap and check for changes in definitions or boundaries. The ACS comparison guide explains these limits.
Use an appropriate statistical test that accounts for the margins of error. Record the method and confidence level. The Census Bureau’s testing tool uses its standard 90% confidence level and also supports 95% and 99%.
Pair demographics with market evidence
Consider a hypothetical planning decision: you want to choose an area for further sales research. An older population may make you ask more questions. It does not prove a need for a particular procedure or product.
Next, examine the clinics: which services do their public sources describe, what other relevant signals are visible, and what evidence connects them to a group? Keep the sources and dates for those findings separate from the demographic figures. DentalCensus’s methodology distinguishes source observations, results of analysis and unknown information.
If evidence is missing, say unknown. Do not turn a missing result into “no.”
A usable territory record
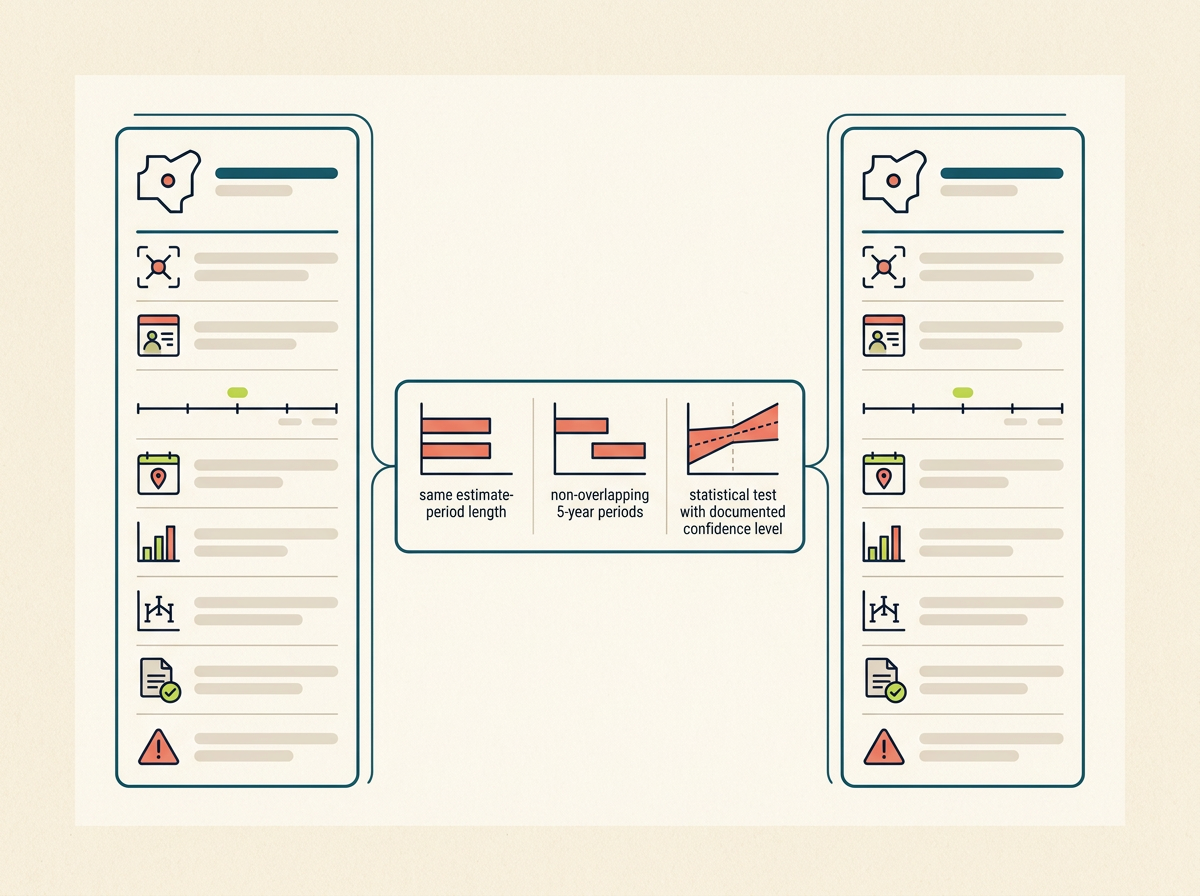
Keep a short note with each figure: area and identifier, exact measure, source, estimate period, boundary year, estimate, margin of error and comparison method. Add known limitations and the separate clinic evidence.
Use that record to decide what to investigate next. It is not a forecast of treatment need, patient behavior, revenue or sales.
Explore market potential and territory research with a clearly defined area, time period and business question.
Evidence and limits
Sources used for this article
This draft uses DentalCensus methodology pages and U.S. Census Bureau ACS guidance retrieved on 2026-09-14. No territory-specific estimates or rankings were supplied. Source cutoff: September 14, 2026.
Methodology: Public-source research with claim-level source IDs; independent fact/evidence and editorial/visual verification. Unknowns remain explicit.
Limits and caveats
- No bounded territory, geography, clinic universe, service thesis, network hypothesis, time window, or decision threshold was supplied; this research cannot select a specific ACS geography or produce a territory ranking.
- No ACS table/variable IDs, values, margins of error, population-estimate series, or release-specific boundary files were retrieved for a particular territory.
- The two DentalCensus seed pages did not display a publication or revision date in the retrieved page text; their publication dates are unknown.
- This retrieval occurred on the supplied cutoff local date (2026-09-14). It does not establish what any webpage displayed earlier on that date or at any prior time.
- No source in this map establishes that population, age, income, or growth predicts dental demand, procedure need, revenue, sales, or any patient-level trait; such inferences are intentionally out of scope.
- No source in this map establishes clinic count, office count, ownership relationship, market share, service availability, or network composition for any named territory.
- Market potential & territory ↗
src_dc_territory · DentalCensus · Accessed 2026-09-14
The page describes territory screening as combining saturation, market-potential scores, and regional demographics to screen markets and decide where deeper practice-level research is warranted. It identifies population, median income, and residents aged 65+ as demographic context, says the score is a decision aid rather than a guaranteed outcome, and says a region or metro should then be layered with clinic services, technology, demand, and network signals.
- Our Data & Methodology ↗
src_dc_data · DentalCensus · Accessed 2026-09-14
The page says current public figures are dated snapshots and collection is rolling and incremental. It distinguishes observed signals from derived intelligence, states that fields, definitions, missingness, and provenance are kept explicit, and says missing evidence remains unknown. Its territory module describes demographics, whitespace, and metro-to-region context; its other modules cover observed clinical services and derived network/ownership structure.
- American Community Survey Data via API ↗
src_acs_api · U.S. Census Bureau · Published 2025-12-17 · Accessed 2026-09-14
The Census Bureau says its ACS API provides access to ACS data. The page lists 2024 ACS 1-year data for areas with populations of 65,000 or more and 2020–2024 ACS 5-year data down to block-group level; it dates the listed 1-year release September 11, 2025 and the listed 5-year release January 29, 2026.
- When is it best to use American Community Survey (ACS) 1-year or 5-year estimates? ↗
src_acs_1v5 · U.S. Census Bureau · Accessed 2026-09-14
The Census Bureau says selection should consider population size, currency, and reliability/precision. It states that 1-year estimates cover areas of 65,000 or more and are most current, while 5-year estimates cover all areas and have a larger sample, making them more precise and reliable but less current.
- Comparing ACS Data ↗
src_acs_compare · U.S. Census Bureau · Published 2026-01-23 · Accessed 2026-09-14
The Census Bureau states that ACS data are sample-based estimates and publishes an MOE for every ACS estimate. It recommends Census or Population Estimates Program data for population totals, ACS for population characteristics such as percents, means, medians, and rates, comparisons only within the same estimate period length, and only non-overlapping ACS 5-year datasets. It warns that variables and geographies may change over time.
- Statistical Testing Tool ↗
src_acs_moe · U.S. Census Bureau · Published 2025-09-24 · Accessed 2026-09-14
The Census Bureau says comparison requires more than observing which estimate is higher or lower: users should conduct statistical testing using the MOEs because ACS estimates are based on a sample. Its tool uses the Census Bureau standard 90% confidence level and can also process 95% or 99% confidence levels.
- Geography Boundaries by Year ↗
src_acs_vintage · U.S. Census Bureau · Published 2026-04-22 · Accessed 2026-09-14
The Census Bureau says ACS generally uses the latest available geographic-boundary vintage; for a 5-year product, the vintage is the final year of its estimate period. It states that 2024 ACS 1-year and 2020–2024 ACS 5-year use the same geography vintage, and lists examples including 2024 census-tract and block-group geography based on the 2020 Census and 2024 metropolitan/micropolitan delineations based on OMB's July 21, 2023 delineations.
Continue the research